Uber shares traffic data with cities
Uber Offers Select Cities Data to Help Ease Tangled Traffic Patterns
Believe it or not, I took my first Uber ride yesterday. Yes, I realize I am slightly behind the times. However, it was a wonderful experience while I was having a very bad day with my automobile. After a few minutes of downloading the Uber app, I was pleasantly surprised at how smooth the whole process worked out.
I was impressed with the map of the city and where the driver’s location was at any given moment. That’s part of what Uber is now offering to certain city officials in New York, Seattle, Nairobi, London and Cincinnati
While Uber had been known to be stingy with its data, this is a welcome change over the last few years. More information means better traffic patterns and other changes for evaluating traffic problems.
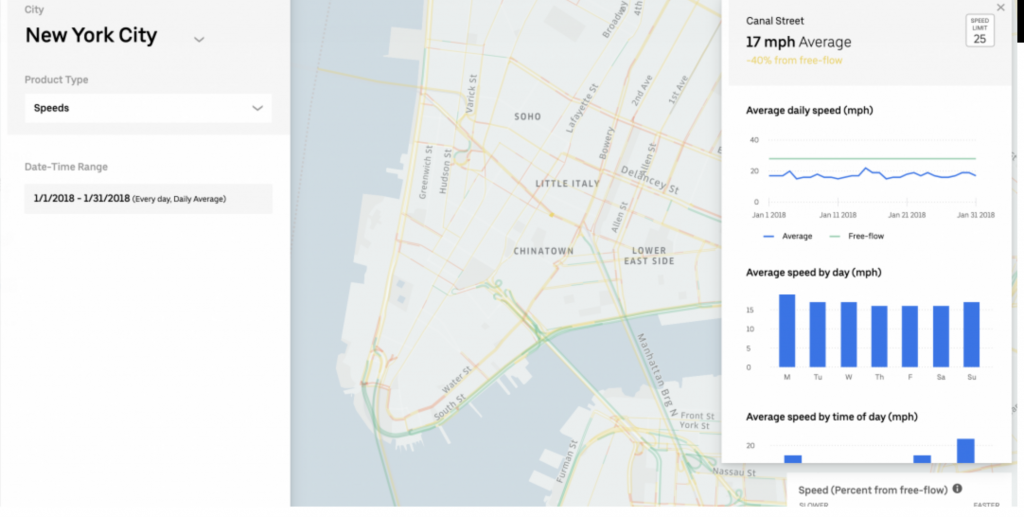
The tool Uber is providing, called Uber Movement gives cities historical aggregated speed data on street segments in some metropolitan areas. Uber Movement is providing real-time stats for city planners and engineers.
In an article on theverge.com, author Andrew J. Hawkins writes that the dataset includes speed averages during specific time ranges, days of the week and times of day. These ranges can be as short as a part of one day or as long as three months. Users can adjust the data to show segments with speeds that fall within a certain value; also which streets have average speeds significantly lower than the regular free flow of traffic. Alternately, streets with higher than average speeds could be targeted for traffic calming measures.
New York City may benefit most from the shared information. A quick glance at over the course of January 2018 reveals a lot of red, meaning speeds that are much slower than free-flowing traffic. That’s not a surprise to regular drivers there. A recent report found the average speed of a car in midtown Manhattan is 4.7 mph — barely faster than walking. Lawmakers cited this statistic, among others, in the run-up to the successful passage of congestion pricing in the city, which would charge drivers a fee to enter the busiest parts of Manhattan during the week.
Uber and its competitor Lyft, are being pointed out as part of the traffic congestion they are fighting against. Another recent study found that between 2010 and 2016, traffic congestion in San Francisco increased by about 60 percent — and Uber and Lyft are responsible for more than half of that increase.
And while hoping to become better partners with the cities in which Uber operates, they will take a stand if they feel they are being shortchanged by municipalities.
Uber strenuously objected to the city of Los Angeles’ attempts to obtain data on scooter and bike usage, calling it a “massive overcollection” that could endanger rider privacy.
read more at theverge.com


Leave A Comment